
What you will learn
- Foundations and Reproducibility
- Reading and Understanding Tables
- Cleaning Real-World Data
- Combining and Summarizing Data
- Exploration and Visualization
- Statistics and Sound Decisions
- Reliable Analysis Workflows
- Complete Retail Analysis Capstone
Course curriculum
8 modules · 32 lessons · follow them in order or jump to any topic
1 Foundations and Reproducibility 4 lessons
2 Reading and Understanding Tables 4 lessons
3 Cleaning Real-World Data 4 lessons
4 Combining and Summarizing Data 5 lessons
5 Exploration and Visualization 3 lessons
6 Statistics and Sound Decisions 4 lessons
7 Reliable Analysis Workflows 5 lessons
8 Complete Retail Analysis Capstone 3 lessons
About this course
Learn to turn messy tables into reliable answers through 32 free, written lectures. Work through a single fictional retail dataset from the first metric definition to a tested, reproducible report. Every lecture includes a worked example, verified output, a practice assignment, a solution, and an explanation of common mistakes.
- Starting point: Basic Python variables, functions, collections, and imports. No prior pandas or statistics knowledge is assumed.
- Language: English.
- Tools: Python 3.12, pandas 3.1, NumPy, Matplotlib, SQLite, and pytest. The downloadable kit pins the tested package versions.
- Project: A complete retail-analysis report with audited data, channel and monthly KPIs, cohort analysis, charts, tests, and a decision memo.
Download the complete course kit · View the completed sample report
What You Will Be Able to Do
- Define a question, row grain, monetary unit, and denominator before calculating a KPI.
- Read CSV and JSON while preserving identifiers and missing-value meaning.
- Clean invalid data, audit duplicates, validate joins, and reconcile totals.
- Use pandas selection, nullable types, grouping, reshaping, time series, and customer cohorts.
- Create clear Matplotlib charts and interpret sampling, bootstrap intervals, A/B tests, and regression assumptions.
- Combine SQL and pandas, process additive summaries in chunks, and deliver tested command-line workflows.
- Explain findings honestly, separate association from causation, and identify the next evidence a decision needs.
Who This Course Is For
This course is for Python learners moving into analytics, developers who work with exports and reporting, and aspiring analysts who want to practise a complete project. If Python functions and imports are new to you, begin with the Python course. SQL knowledge is helpful later, but the SQLite lecture explains the query used in the project.
How to Study the Lectures
- Read Lecture 1 to understand the metric contract, then complete the environment setup in Lecture 2.
- Extract the kit and run each numbered example through
python run_course.py --lesson N --examples-only. - Predict the result, run the code, change one assumption, and compare with the verified output.
- Attempt the assignment before opening its worked solution. Keep a short explanation of what each assertion protects.
- Complete the three-part capstone and use the review rubric to assess your evidence, code, and interpretation.
The Dataset and Completed Project
The dataset contains 244 fictional raw order rows and 48 fictional customer records. Exact duplicates, invalid values, missing identity, and inconsistent channel text are planted deliberately. The project accounts for every raw row and checks that channel, monthly, and regional amounts agree. No real customer information is included.
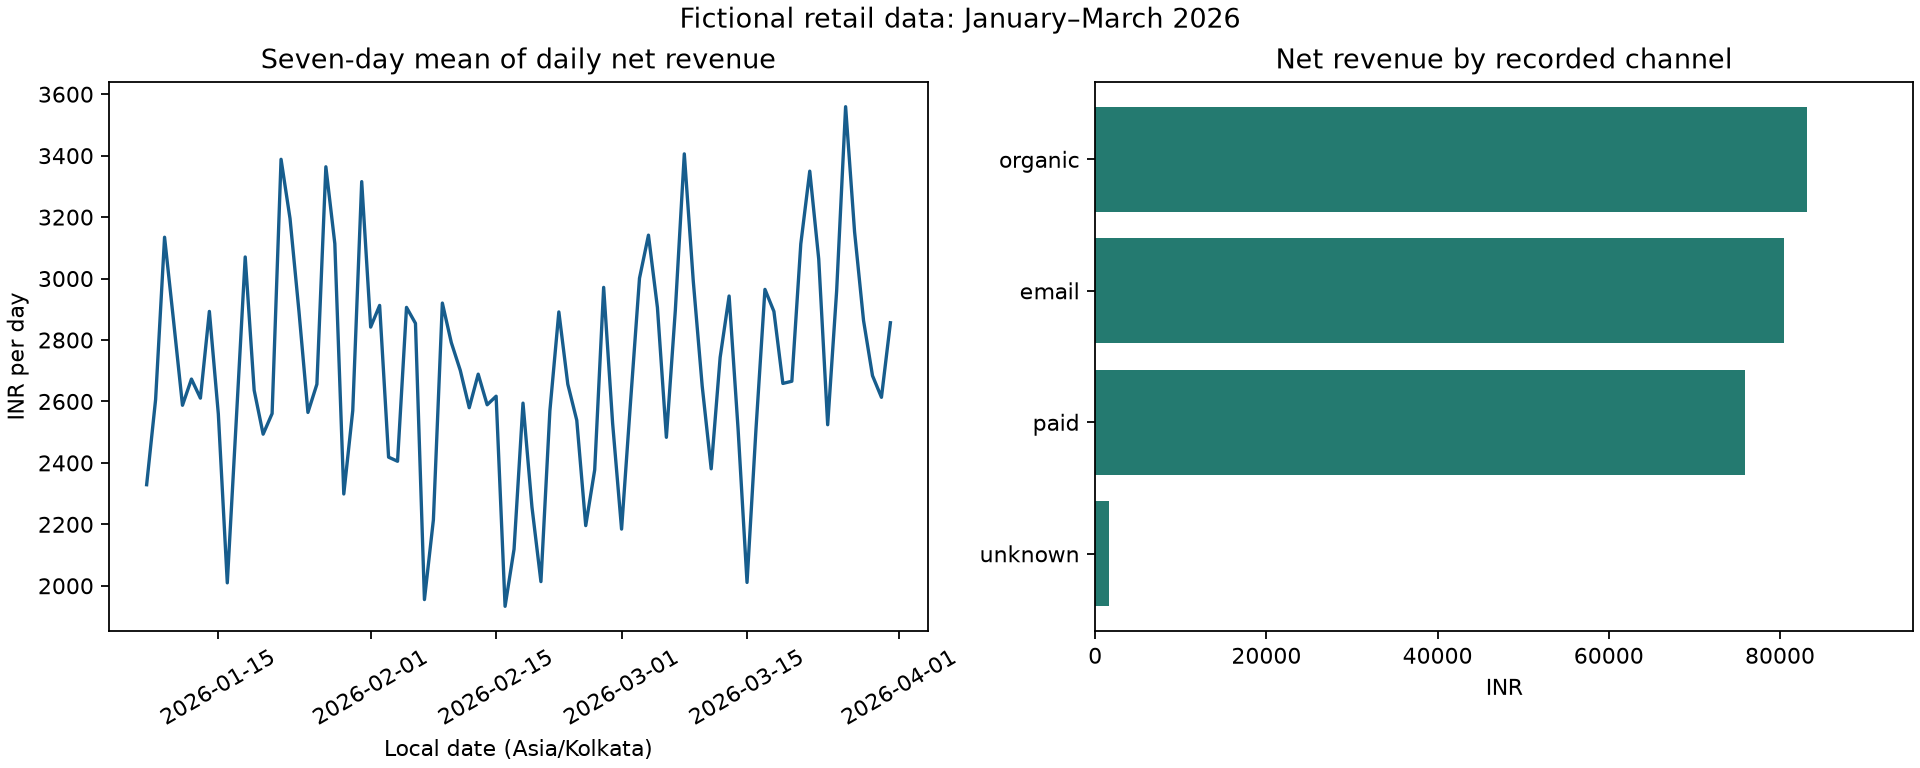
The final report is a teaching artifact. It does not establish real customer behavior, profitability, marketing incrementality, or a causal effect. Learning how to state those limits is part of the course.
What Is in the Download?
The ZIP includes the raw CSVs, a data dictionary, all 32 examples, all 32 practice solutions, the shared cleaner, the report pipeline, a 17-case test suite, pinned requirements, verified outputs, chart files, an offline copy of every lecture, and the capstone brief and rubric.
Frequently Asked Questions
Is the complete course free?
Yes. All lectures and the project kit are free to access. You do not need a paid notebook service or a paid dataset.
Do I need to know Python first?
You should understand variables, functions, lists, dictionaries, and imports. The course introduces NumPy, pandas, and the statistical concepts it uses.
Are these videos or written lectures?
These are written lectures with runnable code, captured output, practice assignments, worked solutions, and references.
Can I use an older pandas version?
The kit is tested with pandas 3.x, including Copy-on-Write behavior. Use the pinned requirements for the closest match to the verified output.
Does completing the course award a certificate?
No certificate or accreditation is issued. The project and rubric help you demonstrate and evaluate your own practice.
Continue Learning
Build connected skills with SQL, PostgreSQL, Machine Learning with Python, and Data Engineering in Depth.